I’m currently working through a unit on probability in Math 2. I’m phrasing that as “working through” because I seriously dislike probability. It’s the only branch of mathematics that is the opposite of intuitive or logical. Luck brought me the cure this summer as I was reorganizing the books in our administrative building’s basement. At some point in our school’s 10-year history, somebody purchased this excellent book: Is Democracy Fair? The Mathematics of Voting and Apportionment by Leslie Johnson Nielsen and Michael de Villiers. The book is from 1997 – one of my students pointed out that it is older than he is (?!!) – yet doesn’t feel outdated. It very well may be, though, because it turns out an updated one, Making Democracy Fair, came out in 2012.
Outdated or not, this book is excellent. Without a reason to use them, students see factorials, floor functions, and geometric mean as just weird math topics that I felt like including in class. This book puts each of these topics (and more!) into historical and political context. We started the unit reading through this Slate article, “Can a Bunch of Mathematicians Make Government More Representative?” I wish that slideshow were working, but it ended up being OK because it’s not difficult to find google images of wacky-looking districts. Students were in small groups, each assigned to a state with 4 districts. The activity I assigned asked them questions like:
“What percentage of the people in district 2 are unhappy with the election results?”
“Based on the state-wide election results, what percentage of the representatives should be Republicans? How many actually are?”
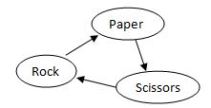
Now we’re working on ordinal ballots, comparing several different methods of determining a winner. The book outlines at least 6 different methods, each somewhat complicated but probably more fair than the winner-takes-all system that we have in the US. Last week we looked at the Condorcet method. To determine a winner, each pair of candidates is compared side-by-side. The best part about this method is that you can make directional graphs based on who wins each contest. Here’s a graph for rock-paper-scissors, for example:
In this case, there is no Condorcet winner, which is a frustrating possibility. That’s especially true if there are 5 candidates being compared, 10 contests, which is going to happen next week, sorry kids!
Here’s the math behind that: 5 candidates being placed into 2-way contests is “5 choose 2,” calculated as 5!/(2!3!) = (5x4x3x2x1) / (2×1)(3x2x1) = 10.
To get a little bit more practice with this directional graph concept, we played Rock-Paper-Scissors-Cheerleader, which led to this graph being created:
I’m unclear on whether the kids are having as much fun as I am, but they are all embracing the cross-curricular aspects of the unit, and seem to understand the links between elections, probability, and math (I’m considering probability separate from math because I still kind of don’t like it : ) ).
I’m doing cool stuff with Pascal’s Triangle with my Math 3 class, so I’ll be posting at least once more before break officially begins next weekend.

